JStat
Jstat is a tool that has been provided in the jdk bin directory since Java 5. It has a number features, which can be examined by using the flag -options:
jstat -optionsThe most significant in my opinion being jstat -gcutils which provides an output of jvm memory by compartment; survivor spaces, eden, old and perm space. Here are the steps if this is new to you:
1. start an demo application: java -jar Java2D.jar
2. get the pid: jps
3. lauch jstat: jstat -gcutil 1483
output:
BTrace
S0     S1     E      O      P     YGC     YGCT    FGC    FGCT     GCT
0.00   0.00  10.61  59.98  76.81      8    0.057     9    0.460    0.516
Btrace is a tool that allows you to inject probes into a running java process to observe and debug an application. I won't go into "how" to use BTrace, as I've blogged on it in the past and the BTrace document does a good job of explaining it.
The area that is lacking is around the @Export annotation for BTrace scripts. There are no details in the documentation and the sample code comments says "// create a jvmstat counter using @Export"... yeah... right... Even the internal code comments and JavaDocs are just as vague. So if you are lost at this point, jstat use to be called jvmstat and was provided as part of the distribution of jvmstat. Even then there is no information on how to leverage the two... until now!!
Creating the Script
Take a look at the ThreadCounter.java file in the sample directory of BTrace. Any value you want to be exposed to jstat will need to be annotated with @Export. Then you will need to assign a value to this exported value with a static method from BtraceUtils. In the ThreadCounter example this is accomplished with perfLong("btrace.com.sun.btrace.samples.ThreadCounter.count"); The next step is to inject this code into a targeted JVM; such as:
btrace 1483 ../samples/ThreadCounter.java
Accessing BTrace exports with jstat
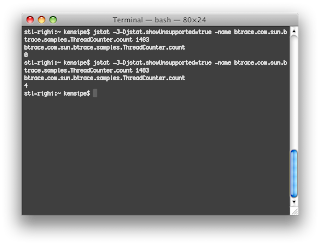
The undocumented trick for jstat is that you have to specify -J-Djstat.showUnsupported=true and -name with the name of the exported variable defined by the perf statement. Here is the full command-line:
jstat -J-Djstat.showUnsupported=true -name btrace.com.sun.btrace.samples.ThreadCounter.count 1483

Thanks to Sundar at Sun for the enlightenment!

2 comments:
Ken you can also use the undocumented (at least in terms of the help) snap option.
http://opencore.jinspired.com/?page_id=377#jstat
William,
thanks for sharing! good stuff.
Post a Comment